

IFF Reports Second Quarter 2018 Results
Achieved strong first half financial results
Reconfirms full year 2018 currency neutral guidance
This press release features multimedia. View the full release here: https://www.businesswire.com/news/home/20180807005861/en/
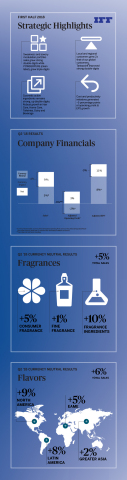
Q2 2018 infographic (Photo: Business Wire)
First Half 2018 Consolidated Summary: Change vs. Prior Year
| Reported (GAAP) | Adjusted (Non-GAAP)¹ | Currency Neutral (Non-GAAP)¹ | |||||||||||||||||||||
| Sales | Operating Profit | EPS | Sales | Operating Profit | EPS | Sales | Operating Profit | EPS | |||||||||||||||
| Consolidated | 11% | 17% | 1% | 11% | 9% | 11% | 6% | 5% | 10% | ||||||||||||||
¹ Schedules at the end of this release contain reconciliations of reported GAAP to non-GAAP metrics.
Second Quarter 2018 Consolidated Summary: Change vs. Prior Year
| Reported (GAAP) | Adjusted (Non-GAAP)¹ | Currency Neutral (Non-GAAP)¹ | |||||||||||||||||||||
| Sales | Operating Profit | EPS | Sales | Operating Profit | EPS | Sales | Operating Profit | EPS | |||||||||||||||
| Consolidated | 9% | 2% | (10)% | 9% | 3% | 11% | 5% | (2)% | 8% | ||||||||||||||
¹ Schedules at the end of this release contain reconciliations of reported GAAP to non-GAAP metrics.
Management Commentary
“Top-line trends remained strong in the second quarter, marking the
fourth consecutive quarter of mid-single digit growth,” said IFF
Chairman and CEO
“Based on our strong year-to-date performance and our current outlook for the balance of the year, we are reconfirming our previously stated full year currency neutral guidance.
“We are progressing toward the completion of our combination
with Frutarom announced during the second quarter. We received Frutarom
shareholder approval, as well as antitrust approval in
“Together with Frutarom, IFF expects to deliver accelerated growth and offer our customers a stronger, more differentiated portfolio of integrated solutions, allowing us to expand beyond our core taste and scent businesses into nutrition. We continue to focus on driving differentiation via R&D, balancing our customer base by emphasizing fast-growing small and mid-sized customers and maximizing our portfolio by expanding into fast-growing and diverse adjacencies. Our combination, especially in the context of the strong performance both companies continue to deliver, is expected to result in significant value creation for our shareholders. We could not be more excited about what the future holds.”
Second Quarter 2018 Consolidated Financial Highlights
-
Reported net sales for the second quarter totaled
$920 million , an increase of 9% from$843 million in 2017. Excluding the impact of foreign exchange, currency neutral sales increased 5% over the prior year. -
Reported operating profit for the second quarter was
$155 million versus$152 million reported in 2017, an increase of 2%. Excluding the impact of foreign exchange and those items that affect comparability, currency neutral adjusted operating profit decreased by 2%. -
Reported earnings per share (EPS) for the second quarter was
$1.25 per diluted share versus$1.38 per diluted share reported in 2017. Excluding the impact of foreign exchange and those items that affect comparability, currency neutral adjusted EPS improved 8%.
Second Quarter 2018 Segment Summary: Growth vs. Prior Year
| Reported (GAAP) |
Currency Neutral (Non-GAAP) |
||||||||
| Sales |
Segment Profit |
Sales |
Segment Profit |
||||||
| Flavors | 9% | 13% | 6% | 6% | |||||
| Fragrances | 10% | 0% | 5% | (9)% | |||||
Flavors Business Unit
-
On a reported basis, sales increased 9%, or
$36.2 million , to$450.5 million . Currency neutral sales grew 6% driven by growth in all categories and all regions. -
EAME increased 16% on a reported basis and 5% on a currency neutral
basis, led by strong double-digit growth in
Africa and theMiddle East as well as mid-single digit growth inEurope . Growth was achieved across all categories, led by strong performances in Dairy, Beverage and Savory. -
North America improved 9% driven by high-single-digit growth at Tastepoint℠ and strong new wins in Beverage, Dairy and Sweet. -
Latin America increased 5% on a reported basis and 8% on a currency neutral basis led by strong double-digit growth inArgentina andMexico . On a category basis, strong double-digit growth was achieved in Savory and Dairy as well as mid-single digit growth in Beverage. -
Greater Asia increased 5% on a reported basis and 2% on a currency neutral basis, as strong double-digit growth inChina andIndia was largely offset by softness inIndonesia andThailand . On a category basis, growth was strongest in Savory, Sweet and Dairy. - Flavors segment profit increased 13% on a reported basis and 6% on a currency neutral basis, driven primarily by volume growth and the benefits from productivity initiatives.
Fragrances Business Unit
-
On a reported basis, sales increased 10%, or
$40.9 million , to$469.5 million . Currency neutral sales improved 5%, with broad-based growth from all categories and nearly all regions. -
Fine Fragrances increased 7% on a reported basis and 1% on a currency
neutral basis led by double-digit growth in LATAM and low-single-digit
growth in
North America . - Consumer Fragrances grew 8% on a reported basis and 5% on a currency neutral basis with growth achieved in all categories. Performance was led by double-digit growth in Hair Care as well as mid-single-digit increases in Toiletries, Home Care & Fabric Care. On a geographic basis, growth was broad-based, with all regions contributing positively to the results.
- Fragrance Ingredients grew 16% on a reported basis and 10% on a currency neutral basis, with increases in three of the four regions.
- Fragrances segment profit was flat on a reported basis and decreased 9% on a currency neutral basis as volume growth and the benefits from productivity initiatives were more than offset by the impact of higher raw material costs, net of price increases, including the previously announced citral supply issue.
The Company’s full year 2018 guidance:
| Currency Neutral | FX Impact1 | Adjusted2 | ||||
| Sales | 3.0% - 5.0% | ~2.0% | 5.0% - 7.0% | |||
| Operating Profit | 5.0% - 7.0% | ~1.5% | 6.5% - 8.5% | |||
| EPS | 4.0% - 6.0% | ~1.5% | 5.5% - 7.5% | |||
1 See Use of Non-GAAP Financial Measures
2
Excludes items impacting comparability
* Excludes
the impact of potential Frutarom transaction
A copy of the Company’s Quarterly Report on Form 10-Q will be available
on its website at www.iff.com
or at www.sec.gov
by
Audio Webcast
A live webcast to discuss the Company’s second quarter 2018 financial
results will be held on
Cautionary Statement Under The Private Securities Litigation Reform Act of 1995
This press release includes “forward-looking statements” under the Federal Private Securities Litigation Reform Act of 1995, including statements regarding our outlook in our full year 2018 guidance, the expected timeline for completion and impact of the combination with Frutarom,
including our focus to drive differentiation, balance our customer base,
maximize our portfolio and our ability to deliver growth across all of
our key financial metrics, and the impact of our actions on value
creation for our shareholders. These forward-looking statements are
qualified in their entirety by cautionary statements and risk factor
disclosures contained in the Company’s
Use of Non-GAAP Financial Measures
We provide in this press release (1) Currency Neutral Sales, (2)
Adjusted Operating Profit and Currency Neutral Adjusted Operating Profit
and (3) Adjusted EPS and Currency Neutral Adjusted EPS, which exclude
restructuring costs and other significant items of a non-recurring
and/or nonoperational nature such as legal charges/credits, losses
(gains) on sale of assets, tax assessment, operational improvement
initiatives, integration costs,
Meet IFF
|
International Flavors & Fragrances Inc. Consolidated Income Statement (Amounts in thousands except per share data) (Unaudited) |
|||||||||||||||||||||||
| Three Months Ended June 30, | Six Months Ended June 30, | ||||||||||||||||||||||
| 2018 | 2017 | % Change | 2018 | 2017 | % Change | ||||||||||||||||||
| Net sales | $ | 920,016 | $ | 842,861 | 9 | % | $ | 1,850,944 | $ | 1,671,154 | 11 | % | |||||||||||
| Cost of goods sold | 521,299 | 469,877 | 11 | % | 1,046,419 | 935,088 | 12 | % | |||||||||||||||
| Gross profit | 398,717 | 372,984 | 7 | % | 804,525 | 736,066 | 9 | % | |||||||||||||||
| Research and development expenses | 74,767 | 72,761 | 3 | % | 153,244 | 144,887 | 6 | % | |||||||||||||||
| Selling and administrative expenses | 157,407 | 139,319 | 13 | % | 300,051 | 283,023 | 6 | % | |||||||||||||||
| Amortization of acquisition-related intangibles | 9,584 | 8,494 | 13 | % | 18,769 | 15,561 | 21 | % | |||||||||||||||
| Restructuring and other charges, net | 1,186 | 791 | 50 | % | 1,903 | 10,934 | -83 | % | |||||||||||||||
| Losses (gains) on sales of fixed assets | 1,264 | (68 | ) | N/A | 1,195 | (89 | ) | N/A | |||||||||||||||
| Operating profit | 154,509 | 151,687 | 2 | % | 329,363 | 281,750 | 17 | % | |||||||||||||||
| Interest expense | 53,246 | 17,556 | 203 | % | 69,841 | 30,363 | 130 | % | |||||||||||||||
| Other (income), net | (20,655 | ) | (7,909 | ) | 161 | % | (21,232 | ) | (29,140 | ) | -27 | % | |||||||||||
| Income before taxes | 121,918 | 142,040 | -14 | % | 280,754 | 280,527 | 0 | % | |||||||||||||||
| Taxes on income | 22,769 | 32,245 | -29 | % | 52,190 | 54,968 | -5 | % | |||||||||||||||
| Net income | $ | 99,149 | $ | 109,795 | -10 | % | $ | 228,564 | $ | 225,559 | 1 | % | |||||||||||
| Earnings per share - basic | $ | 1.25 | $ | 1.39 | $ | 2.89 | $ | 2.85 | |||||||||||||||
| Earnings per share - diluted | $ | 1.25 | $ | 1.38 | $ | 2.87 | $ | 2.84 | |||||||||||||||
| Average shares outstanding | |||||||||||||||||||||||
| Basic | 79,065 | 79,072 | 79,041 | 79,088 | |||||||||||||||||||
| Diluted | 79,303 | 79,305 | 79,347 | 79,360 | |||||||||||||||||||
|
International Flavors & Fragrances Inc. Condensed Consolidated Balance Sheet (Amounts in thousands) (Unaudited) |
||||||
| June 30, | December 31, | |||||
| 2018 | 2017 | |||||
| Cash and cash equivalents | $ | 322,423 | $ | 368,046 | ||
| Receivables | 723,855 | 663,663 | ||||
| Inventories | 695,192 | 649,448 | ||||
| Other current assets | 285,110 | 215,387 | ||||
| Total current assets | 2,026,580 | 1,896,544 | ||||
| Property, plant and equipment, net | 867,629 | 880,580 | ||||
| Goodwill and other intangibles, net | 1,540,012 | 1,572,075 | ||||
| Other assets | 239,221 | 249,727 | ||||
| Total assets | $ | 4,673,442 | $ | 4,598,926 | ||
| Bank borrowings, commercial paper, overdrafts and current portion of long-term debt | $ | 6,500 | $ | 6,966 | ||
| Other current liabilities | 692,870 | 761,802 | ||||
| Total current liabilities | 699,370 | 768,768 | ||||
| Long-term debt | 1,717,189 | 1,632,186 | ||||
| Non-current liabilities | 500,680 | 508,678 | ||||
| Shareholders' equity | 1,756,203 | 1,689,294 | ||||
| Total liabilities and shareholders' equity | $ | 4,673,442 | $ | 4,598,926 | ||
|
International Flavors & Fragrances Inc. Consolidated Statement of Cash Flows (Amounts in thousands) (Unaudited) |
||||||||
| Six Months Ended June 30, | ||||||||
| 2018 | 2017 | |||||||
| Cash flows from operating activities: | ||||||||
| Net income | $ | 228,564 | $ | 225,559 | ||||
| Adjustments to reconcile to net cash provided by operating activities: | ||||||||
| Depreciation and amortization | 64,968 | 55,805 | ||||||
| Deferred income taxes | 14,342 | 1,505 | ||||||
|
Loss (gain) on disposal of assets |
1,195 | (89 | ) | |||||
| Stock-based compensation | 15,173 | 12,893 | ||||||
| Pension contributions | (9,963 | ) | (31,557 | ) | ||||
| Litigation settlement | - | (56,000 | ) | |||||
| Product recall claim settlement |
(12,969 |
) | - | |||||
| Foreign currency gain on liquidation of entity | - | (12,214 | ) | |||||
| Changes in assets and liabilities, net of acquisitions: | ||||||||
| Trade receivables | (99,963 | ) | (77,580 | ) | ||||
| Inventories | (67,940 | ) | (4,228 | ) | ||||
| Accounts payable | (7,139 | ) | (23,479 | ) | ||||
| Accruals for incentive compensation | (25,158 | ) | (12,316 | ) | ||||
| Other current payables and accrued expenses | 11,028 | (3,099 | ) | |||||
| Other assets | (65,620 | ) | 18,007 | |||||
| Other liabilities | 8,651 | (35,286 | ) | |||||
| Net cash provided by operating activities | 55,169 | 57,921 | ||||||
| Cash flows from investing activities: | ||||||||
| Cash paid for acquisitions, net of cash received | (22 | ) | (191,304 | ) | ||||
| Additions to property, plant and equipment | (67,421 | ) | (46,153 | ) | ||||
| Proceeds from life insurance contracts | - | 1,941 | ||||||
| Maturity of net investment hedges | (2,642 | ) | 3,016 | |||||
| Proceeds from disposal of assets | 618 | 473 | ||||||
| Net cash used in investing activities | (69,467 | ) | (232,027 | ) | ||||
| Cash flows from financing activities: | ||||||||
| Cash dividends paid to shareholders | (108,824 | ) | (101,184 | ) | ||||
| Increase in revolving credit facility borrowings and overdrafts | 110,259 | 21,595 | ||||||
| Deferred financing costs | (1,401 | ) | (5,373 | ) | ||||
| Proceeds from issuance of long-term debt | - | 498,250 | ||||||
| (Loss) on pre-issuance hedges | - | (5,310 | ) | |||||
| Proceeds from issuance of stock under stock plans | - | 329 | ||||||
| Employee withholding taxes paid | (9,096 | ) | (11,485 | ) | ||||
| Purchase of treasury stock | (15,475 | ) | (53,211 | ) | ||||
| Net cash (used in) provided by financing activities | (24,537 | ) | 343,611 | |||||
| Effect of exchange rates changes on cash and cash equivalents | (6,788 | ) | (2,111 | ) | ||||
| Net change in cash and cash equivalents | (45,623 | ) | 167,394 | |||||
| Cash and cash equivalents at beginning of year | 368,046 | 323,992 | ||||||
| Cash and cash equivalents at end of period | $ | 322,423 | $ | 491,386 | ||||
|
International Flavors & Fragrances Inc. Business Unit Performance (Amounts in thousands) (Unaudited) |
||||||||||||||||
| Three Months Ended June 30, | Six Months Ended June 30, | |||||||||||||||
| 2018 | 2017 | 2018 | 2017 | |||||||||||||
| Net Sales | ||||||||||||||||
| Flavors | $ | 450,540 | $ | 414,323 | $ | 899,559 | $ | 820,487 | ||||||||
| Fragrances | 469,476 | 428,538 | 951,385 | 850,667 | ||||||||||||
| Consolidated | 920,016 | 842,861 | 1,850,944 | 1,671,154 | ||||||||||||
| Segment Profit | ||||||||||||||||
| Flavors | 109,605 | 96,840 | 221,169 | 191,395 | ||||||||||||
| Fragrances | 80,780 | 80,993 | 174,056 | 158,867 | ||||||||||||
| Global Expenses | (20,572 | ) | (13,488 | ) | (44,398 | ) | (29,781 | ) | ||||||||
| Operational Improvement Initiatives | (403 | ) | (445 | ) | (1,429 | ) | (1,066 | ) | ||||||||
| Acquisition Related Costs | 4 | (6,278 | ) | 518 | (15,066 | ) | ||||||||||
| Integration Related Costs | (993 | ) | (731 | ) | (993 | ) | (1,923 | ) | ||||||||
| Legal Charges/Credits, net | - | (1,000 | ) | - | (1,000 | ) | ||||||||||
| Tax Assessment | - | 19 | - | (5,331 | ) | |||||||||||
| Restructuring and Other Charges, net | (193 | ) | (791 | ) | (910 | ) | (10,934 | ) | ||||||||
| (Losses) Gains on Sale of Assets | (1,264 | ) | 68 | (1,195 | ) | 89 | ||||||||||
| FDA Mandated Product Recall | - | (3,500 | ) | (5,000 | ) | (3,500 | ) | |||||||||
| Frutarom Acquisition Related Costs | (12,455 | ) | - | (12,455 | ) | - | ||||||||||
| Operating profit | 154,509 | 151,687 | 329,363 | 281,750 | ||||||||||||
| Interest Expense | (53,246 | ) | (17,556 | ) | (69,841 | ) | (30,363 | ) | ||||||||
| Other income (expense), net | 20,655 | 7,909 | 21,232 | 29,140 | ||||||||||||
| Income before taxes | $ | 121,918 | $ | 142,040 | $ | 280,754 | $ | 280,527 | ||||||||
| Operating Margin | ||||||||||||||||
| Flavors | 24.3 | % | 23.4 | % | 24.6 | % | 23.3 | % | ||||||||
| Fragrances | 17.2 | % | 18.9 | % | 18.3 | % | 18.7 | % | ||||||||
| Consolidated | 16.8 | % | 18.0 | % | 17.8 | % | 16.9 | % | ||||||||
|
International Flavors & Fragrances Inc. Sales Performance by Region and Category (Unaudited) |
|||||||||||||||
| Second Quarter 2018 vs. 2017 | |||||||||||||||
| Percentage Change in Sales by Region of Destination | |||||||||||||||
| Fine | Consumer Fragrances | Ingredients | Total Frag. | Flavors | Total | ||||||||||
| North America | Reported | 2% | 4% | 20% | 7% | 9% | 8% | ||||||||
| EAME | Reported | 8% | 15% | 7% | 11% | 16% | 13% | ||||||||
| Currency Neutral | -2% | 4% | -2% | 1% | 5% | 2% | |||||||||
| Latin America | Reported | 8% | 6% | 6% | 6% | 5% | 6% | ||||||||
| Currency Neutral | 10% | 6% | 5% | 7% | 8% | 7% | |||||||||
| Greater Asia | Reported | -5% | 7% | 39% | 12% | 5% | 8% | ||||||||
| Currency Neutral | -9% | 5% | 34% | 9% | 2% | 5% | |||||||||
| Total | Reported | 7% | 8% | 16% | 10% | 9% | 9% | ||||||||
| Currency Neutral | 1% | 5% | 10% | 5% | 6% | 5% | |||||||||
| First Six Months 2018 vs. First Six Months 2017 | |||||||||||||||
| Percentage Change in Sales by Region of Destination | |||||||||||||||
| Fine | Consumer Fragrances | Ingredients | Total Frag. | Flavors | Total | ||||||||||
| North America | Reported | 6% | 8% | 13% | 9% | 9% | 9% | ||||||||
| EAME | Reported | 8% | 17% | 18% | 14% | 20% | 16% | ||||||||
| Currency Neutral | -3% | 4% | 7% | 3% | 8% | 5% | |||||||||
| Latin America | Reported | 21% | 4% | 16% | 9% | 2% | 6% | ||||||||
| Currency Neutral | 21% | 4% | 14% | 9% | 3% | 7% | |||||||||
| Greater Asia | Reported | -10% | 8% | 47% | 13% | 5% | 9% | ||||||||
| Currency Neutral | -13% | 5% | 41% | 10% | 2% | 5% | |||||||||
| Total | Reported | 9% | 10% | 21% | 12% | 10% | 11% | ||||||||
| Currency Neutral | 3% | 5% | 14% | 6% | 6% | 6% | |||||||||
Currency neutral growth is calculated by translating prior year sales at the exchange rates used for the corresponding 2018 period.
|
International Flavors & Fragrances Inc. GAAP to Non-GAAP Reconciliation Foreign Exchange Impact (Unaudited) |
||||||
| Q2 Consolidated | Sales |
Operating Profit |
EPS | |||
| % Change - Reported (GAAP) | 9% | 2% | -10% | |||
| Items Impacting Comparability | 0% | 1% | 20% | |||
| % Change - Adjusted (Non-GAAP) | 9% | 3% | 11%* | |||
| Currency Impact | -4% | -6% | -3% | |||
| % Change - Currency Neutral (Adjusted) | 5% | -2%* | 8% | |||
| Q2 Flavors | Sales |
Segment Profit |
||||
| % Change - Reported (GAAP) | 9% | 13% | ||||
| Currency Impact | -3% | -7% | ||||
| % Change - Currency Neutral | 6% | 6% | ||||
| Q2 Fragrances | Sales |
Segment Profit |
||||
| % Change - Reported (GAAP) | 10% | 0% | ||||
| Currency Impact | -5% | -9% | ||||
| % Change - Currency Neutral | 5% | -9% | ||||
| 1H Consolidated | Sales |
Operating Profit |
EPS | |||
| % Change - Reported (GAAP) | 11% | 17% | 1% | |||
| Items Impacting Comparability | 0% | -7% | 10% | |||
| % Change - Adjusted (Non-GAAP) | 11% | 9%* | 11% | |||
| Currency Impact | -5% | -5% | -1% | |||
| % Change - Currency Neutral (Adjusted) | 6% | 5%* | 10% | |||
*Item does not foot due to rounding
GAAP to
Non-GAAP Reconciliation
(Amounts in thousands)
(Unaudited)
The following information and schedules provide reconciliation information between reported GAAP amounts and non-GAAP certain adjusted amounts. This information and schedules are not intended as, and should not be viewed as, a substitute for reported GAAP amounts or financial statements of the Company prepared and presented in accordance with GAAP.
| Reconciliation of Gross Profit | ||||||||
| Second Quarter | ||||||||
| 2018 | 2017 | |||||||
| Reported (GAAP) | $ | 398,717 | $ | 372,984 | ||||
| Operational Improvement Initiatives (a) | 403 | 445 | ||||||
| Acquisition Related Costs (b) | - | 5,606 | ||||||
| Integration Related Costs (c) | - | 98 | ||||||
| FDA Mandated Product Recall (g) | - | 3,500 | ||||||
| Adjusted (Non-GAAP) | $ | 399,120 | $ | 382,633 | ||||
| Reconciliation of Selling and Administrative Expenses | ||||||||
| Second Quarter | ||||||||
| 2018 | 2017 | |||||||
| Reported (GAAP) | $ | 157,407 | $ | 139,319 | ||||
| Acquisition Related Costs (b) | 4 | (672 | ) | |||||
| Integration Related Costs (c) | - | (542 | ) | |||||
| Legal Charges/Credits, net (d) | - | (1,000 | ) | |||||
| Tax Assessment (e) | - | 19 | ||||||
| Frutarom Acquisition Related Costs (h) | (12,455 | ) | - | |||||
| Adjusted (Non-GAAP) | $ | 144,956 | $ | 137,124 | ||||
| Reconciliation of Operating Profit | ||||||||
| Second Quarter | ||||||||
| 2018 | 2017 | |||||||
| Reported (GAAP) | $ | 154,509 | $ | 151,687 | ||||
| Operational Improvement Initiatives (a) | 403 | 445 | ||||||
| Acquisition Related Costs (b) | (4 | ) | 6,278 | |||||
| Integration Related Costs (c) | 993 | 731 | ||||||
| Legal Charges/Credits, net (d) | - | 1,000 | ||||||
| Tax Assessment (e) | - | (19 | ) | |||||
| Restructuring and Other Charges, net (f) | 193 | 791 | ||||||
| Losses (Gains) on Sale of Assets | 1,264 | (68 | ) | |||||
| FDA Mandated Product Recall (g) | - | 3,500 | ||||||
| Frutarom Acquisition Related Costs (h) | 12,455 | - | ||||||
| Adjusted (Non-GAAP) | $ | 169,813 | $ | 164,345 | ||||
GAAP to
Non-GAAP Reconciliation
(Amounts in thousands)
(Unaudited)
The following information and schedules provide reconciliation information between reported GAAP amounts and non-GAAP certain adjusted amounts. This information and schedules are not intended as, and should not be viewed as, a substitute for reported GAAP amounts or financial statements of the Company prepared and presented in accordance with GAAP.
|
Reconciliation of Net Income |
||||||||||||||||||||||||||||||
| Second Quarter | ||||||||||||||||||||||||||||||
| 2018 | 2017 | |||||||||||||||||||||||||||||
| Income before taxes |
Taxes on income (i) |
Net income | EPS (j) | Income before taxes |
Taxes on income (i) |
Net income | EPS | |||||||||||||||||||||||
| Reported (GAAP) | $ | 121,918 | $ | 22,769 | $ | 99,149 | $ | 1.25 | $ | 142,040 | $ | 32,245 | $ | 109,795 | $ | 1.38 | ||||||||||||||
| Operational Improvement Initiatives (a) | 403 | 142 | 261 | - | 445 | 111 | 334 | - | ||||||||||||||||||||||
| Acquisition Related Costs (b) | (4 | ) | (1 | ) | (3 | ) | - | 6,278 | 1,472 | 4,806 | 0.06 | |||||||||||||||||||
| Integration Related Costs (c) | 993 | - | 993 | 0.01 | 731 | 243 | 488 | 0.01 | ||||||||||||||||||||||
| Legal Charges/Credits, net (d) | - | - | - | - | 1,000 | 354 | 646 | 0.01 | ||||||||||||||||||||||
| Tax Assessment (e) | - | - | - | - | (19 | ) | (7 | ) | (12 | ) | - | |||||||||||||||||||
| Restructuring and Other Charges, net (f) | 193 | 46 | 147 | - | 791 | (75 | ) | 866 | 0.01 | |||||||||||||||||||||
| Losses (Gains) on Sale of Assets | 1,264 | 263 | 1,001 | 0.01 | (68 | ) | (22 | ) | (46 | ) | - | |||||||||||||||||||
| FDA Mandated Product Recall (g) | - | - | - | - | 3,500 | 1,238 | 2,262 | 0.03 | ||||||||||||||||||||||
| Frutarom Acquisition Related Costs (h) | 36,989 | 6,543 | 30,446 | 0.38 | - | - | - | - | ||||||||||||||||||||||
| Adjusted (Non-GAAP) | $ | 161,756 | $ | 29,762 | $ | 131,994 | $ | 1.66 | $ | 154,698 | $ | 35,559 | $ | 119,139 | $ | 1.50 | ||||||||||||||
| (a) | For 2018, represents accelerated depreciation related to a plant relocation in India. For 2017, represents accelerated depreciation and idle labor costs in Hangzhou, China. | |
| (b) | For 2017, represents the amortization of inventory "step-up" related to the acquisitions of David Michael, Fragrance Resources and PowderPure, included in cost of goods sold and transaction costs related to the acquisitions of David Michael, Fragrance Resources and PowderPure, included in Selling and administrative expenses. | |
| (c) | For 2018, represents costs related to the integration of David Michael. For 2017, represents costs related to the integration of David Michael and Fragrance Resources acquisitions. | |
| (d) | Represents additional charge related to litigation settlement. | |
| (e) | Represents the reserve for payment of a tax assessment related to commercial rent for prior periods. | |
| (f) | Represents severance costs related to the 2017 Productivity Program. | |
| (g) | Represents management's best estimate of losses related to the previously disclosed FDA mandated recall. | |
| (h) | Represents transaction-related costs and expenses related to the pending acquisition of Frutarom. Amount includes $10.6 million of bridge loan commitment fees included in Interest expense, $25.0 million mark-to-market loss adjustment on an interest rate derivative and an $11.0 million mark-to-market gain adjustment on a foreign currency derivative, and $12.5 million of transaction costs included in administrative expenses. | |
| (i) | The income tax expense (benefit) on non-GAAP adjustments is computed in accordance with ASC 740 using the same methodology as the GAAP provision of income taxes. Income tax effects of non-GAAP adjustments are calculated based on the applicable statutory tax rate for each jurisdiction in which such charges were incurred, except for those items which are non-taxable for which the tax expense (benefit) was calculated at 0%. For second quarter of 2018, certain non-GAAP adjustments were subject to valuation allowances and therefore was calculated at 0%. | |
| (j) | The sum of these items does not foot due to rounding. | |
| The Company tracks the amount of amortization recorded on recent acquisitions in order to monitor its progress with respect to its Vision 2020 goals. The following amounts were recorded with respect to recent acquisitions: $0.7M related to PowderPure, $2.0M related to Fragrance Resources, $1.1M related to David Michael, $1.6M related to Ottens Flavors, and $2.0M related to Lucas Meyer Cosmetics. | ||
GAAP to
Non-GAAP Reconciliation
(Amounts in thousands)
(Unaudited)
The following information and schedules provide reconciliation information between reported GAAP amounts and non-GAAP certain adjusted amounts. This information and schedules are not intended as, and should not be viewed as, a substitute for reported GAAP amounts or financial statements of the Company prepared and presented in accordance with GAAP.
| Reconciliation of Gross Profit | |||||||
| Second Quarter Year-to-Date | |||||||
| 2018 | 2017 | ||||||
| Reported (GAAP) | $ | 804,525 | $ | 736,066 | |||
| Operational Improvement Initiatives (a) | 856 | 1,066 | |||||
| Acquisition Related Costs (b) | - | 10,907 | |||||
| Integration Related Costs (c) | - | 186 | |||||
| FDA Mandated Product Recall (h) | 5,000 | 3,500 | |||||
| Adjusted (Non-GAAP) | $ | 810,381 | $ | 751,725 | |||
| Reconciliation of Selling and Administrative Expenses | |||||||
| Second Quarter Year-to-Date | |||||||
| 2018 | 2017 | ||||||
| Reported (GAAP) | $ | 300,051 | $ | 283,023 | |||
| Acquisition Related Costs (b) | 518 | (4,159 | ) | ||||
| Integration Related Costs (c) | - | (1,485 | ) | ||||
| Legal Charges/Credits, net (d) | - | (1,000 | ) | ||||
| Tax Assessment (e) | - | (5,331 | ) | ||||
| Frutarom Acquisition Related Costs (j) | (12,455 | ) | - | ||||
| Adjusted (Non-GAAP) | $ | 288,114 | $ | 271,048 | |||
| Reconciliation of Operating Profit | |||||||
| Second Quarter Year-to-Date | |||||||
| 2018 | 2017 | ||||||
| Reported (GAAP) | $ | 329,363 | $ | 281,750 | |||
| Operational Improvement Initiatives (a) | 1,429 | 1,066 | |||||
| Acquisition Related Costs (b) | (518 | ) | 15,066 | ||||
| Integration Related Costs (c) | 993 | 1,923 | |||||
| Legal Charges/Credits, net (d) | - | 1,000 | |||||
| Tax Assessment (e) | - | 5,331 | |||||
| Restructuring and Other Charges, net (f) | 910 | 10,934 | |||||
| Losses (Gains) on Sale of Assets | 1,195 | (89 | ) | ||||
| FDA Mandated Product Recall (h) | 5,000 | 3,500 | |||||
| Frutarom Acquisition Related Costs (j) | 12,455 | - | |||||
| Adjusted (Non-GAAP) | $ | 350,827 | $ | 320,481 | |||
GAAP to
Non-GAAP Reconciliation
(Amounts in thousands)
(Unaudited)
The following information and schedules provide reconciliation information between reported GAAP amounts and non-GAAP certain adjusted amounts. This information and schedules are not intended as, and should not be viewed as, a substitute for reported GAAP amounts or financial statements of the Company prepared and presented in accordance with GAAP.
| Reconciliation of Net Income | |||||||||||||||||||||||||||||||
| Second Quarter Year-to-Date | |||||||||||||||||||||||||||||||
| 2018 | 2017 | ||||||||||||||||||||||||||||||
|
Income before taxes |
Taxes on income (k) |
Net income | EPS |
Income before taxes |
Taxes on income (k) |
Net income | EPS (l) | ||||||||||||||||||||||||
| Reported (GAAP) | $ | 280,754 | $ | 52,190 | $ | 228,564 | $ | 2.87 | $ | 280,527 | $ | 54,968 | $ | 225,559 | $ | 2.84 | |||||||||||||||
| Operational Improvement Initiatives (a) | 1,429 | 436 | 993 | 0.01 | 1,066 | 266 | 800 | 0.01 | |||||||||||||||||||||||
| Acquisition Related Costs (b) | (518 | ) | (135 | ) | (383 | ) | - | 15,066 | 4,610 | 10,456 | 0.13 | ||||||||||||||||||||
| Integration Related Costs (c) | 993 | - | 993 | 0.01 | 1,922 | 605 | 1,317 | 0.02 | |||||||||||||||||||||||
| Legal Charges/Credits, net (d) | - | - | - | - | 1,000 | 354 | 646 | 0.01 | |||||||||||||||||||||||
| Tax Assessment (e) | - | - | - | - | 5,331 | 1,885 | 3,446 | 0.04 | |||||||||||||||||||||||
| Restructuring and Other Charges, net (f) | 910 | 215 | 695 | 0.01 | 10,934 | 2,892 | 8,042 | 0.10 | |||||||||||||||||||||||
| Losses (Gains) on Sale of Assets | 1,195 | 246 | 949 | 0.01 | (89 | ) | (29 | ) | (60 | ) | - | ||||||||||||||||||||
| CTA Realization (g) | - | - | - | - | (12,214 | ) | - | (12,214 | ) | (0.15 | ) | ||||||||||||||||||||
| FDA Mandated Product Recall (h) | 5,000 | 1,196 | 3,804 | 0.05 | 3,500 | 1,238 | 2,262 | 0.03 | |||||||||||||||||||||||
| U.S. Tax Reform (i) | - | (649 | ) | 649 | 0.01 | - | - | - | - | ||||||||||||||||||||||
| Frutarom Acquisition Related Costs (j) | 36,989 | 6,543 | 30,446 | 0.38 | - | - | - | - | |||||||||||||||||||||||
| Adjusted (Non-GAAP) | $ | 326,752 | $ | 60,042 | $ | 266,710 | $ | 3.35 | $ | 307,043 | $ | 66,789 | $ | 240,254 | $ | 3.02 | |||||||||||||||
| (a) | For 2018, represents accelerated depreciation related to a plant relocation in India. For 2017, represents accelerated depreciation and idle labor costs in Hangzhou, China. | |
| (b) | For 2018, represents adjustments to the contingent consideration payable for PowderPure, and transaction costs related to Fragrance Resources and PowderPure within Selling and administrative expenses. For 2017, represents the amortization of inventory "step-up" related to the acquisitions of David Michael, Fragrance Resources and PowderPure, included in cost of goods sold and transaction costs related to the acquisitions of David Michael, Fragrance Resources and PowderPure, included in Selling and administrative expenses. | |
| (c) | For 2018, represents costs related to the integration of David Michael. For 2017, represents costs related to the integration of David Michael and Fragrance Resources acquisitions. | |
| (d) | Represents additional charge related to litigation settlement. | |
| (e) | Represents the reserve for payment of a tax assessment related to commercial rent for prior periods. | |
| (f) | Represents severance costs related to the 2017 Productivity Program and Taiwan lab closure. | |
| (g) | Represents the release of CTA related to the liquidation of a foreign entity. | |
| (h) | Represents management's best estimate of losses related to the previously disclosed FDA mandated recall. | |
| (i) | Represents charges incurred related to enactment of certain U.S. tax legislation changes in December 2017. | |
| (j) | Represents transaction-related costs and expenses related to the pending acquisition of Frutarom. Amount includes $10.6 million of bridge loan commitment fees included in Interest expense, $25.0 million mark-to-market loss adjustment on an interest rate derivative and an $11.0 million mark-to-market gain adjustment on a foreign currency derivative, and $12.5 million of transaction costs included in administrative expenses. | |
| (k) | The income tax expense (benefit) on non-GAAP adjustments is computed in accordance with ASC 740 using the same methodology as the GAAP provision of income taxes. Income tax effects of non-GAAP adjustments are calculated based on the applicable statutory tax rate for each jurisdiction in which such charges were incurred, except for those items which are non-taxable for which the tax expense (benefit) was calculated at 0%. For second quarter of 2018, certain non-GAAP adjustments were subject to valuation allowances and therefore was calculated at 0%. | |
| (l) | The sum of these items does not foot due to rounding. | |
| The Company tracks the amount of amortization recorded on recent acquisitions in order to monitor its progress with respect to its Vision 2020 goals. The following amounts were recorded with respect to recent acquisitions: $1.4M related to PowderPure, $4.0M related to Fragrance Resources, $2.3M related to David Michael, $3.1M related to Ottens Flavors, and $4.3M related to Lucas Meyer Cosmetics. | ||
View source version on businesswire.com: https://www.businesswire.com/news/home/20180807005861/en/
Source: IFF
IFF
Michael DeVeau, 212-708-7164
VP, Corporate Strategy,
Investor Relations & Communications
Michael.DeVeau@iff.com